Monitor current site devices and the status of components.
- On the Monitoring System menu, select Status.
- Click the device in question.
The component that generated an error displays in yellow or red.
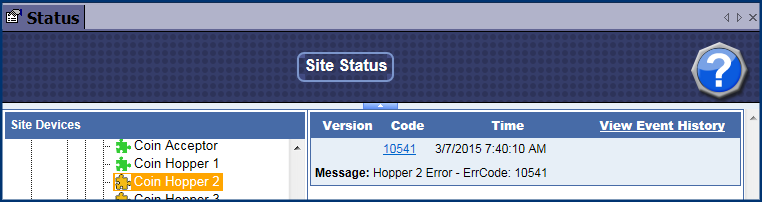
- Click the component to view error details.
The error code appears with an error message, and incident date and time.
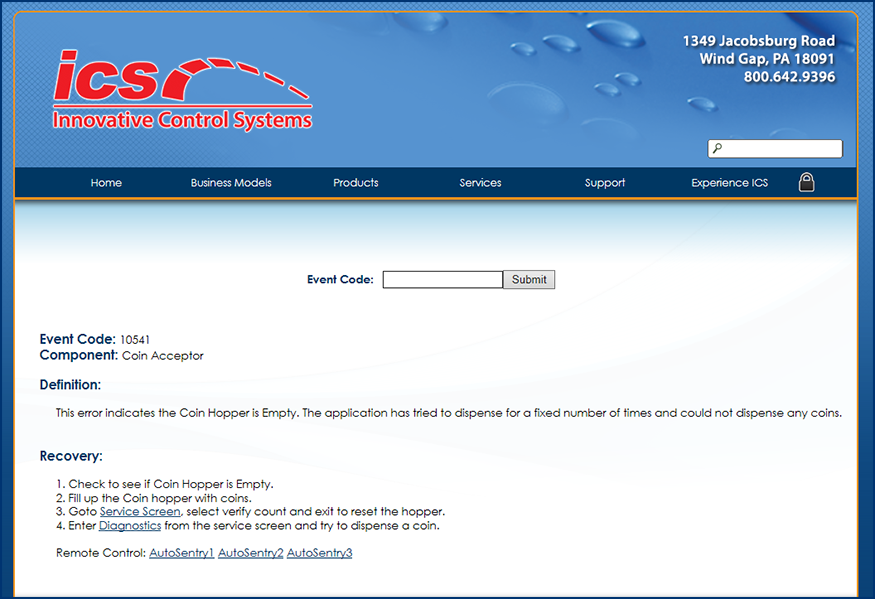
- Click on the Code link.
Each error or event code links to an online database with step-by-step troubleshooting instructions.
NOTE: You can also receive email alerts with error codes. See Subscribe to Email Alerts.