To view a bar graph for the Utility Bills, follow these steps:
- On the Utilities menu, click to select Manage Utility Bills button.
- Click the Utility Usage Chart button.

- In the Utilities box, click to select the Utilities from the list to display on the Usage Chart.
- In the Site box, select a site.
- In the Period box, select either day or month. This shows utility consumption by either a day-by-day or bill-by-bill option.
- In the Bar Value box, select one of the following: Cost per Car, or Usage per Car.
- In the Date Range box, select the dates that you want to use to generate the chart.
- Click the Search button.

The Manage Utility Bills report appears.
- You can Print or Cancel the report.


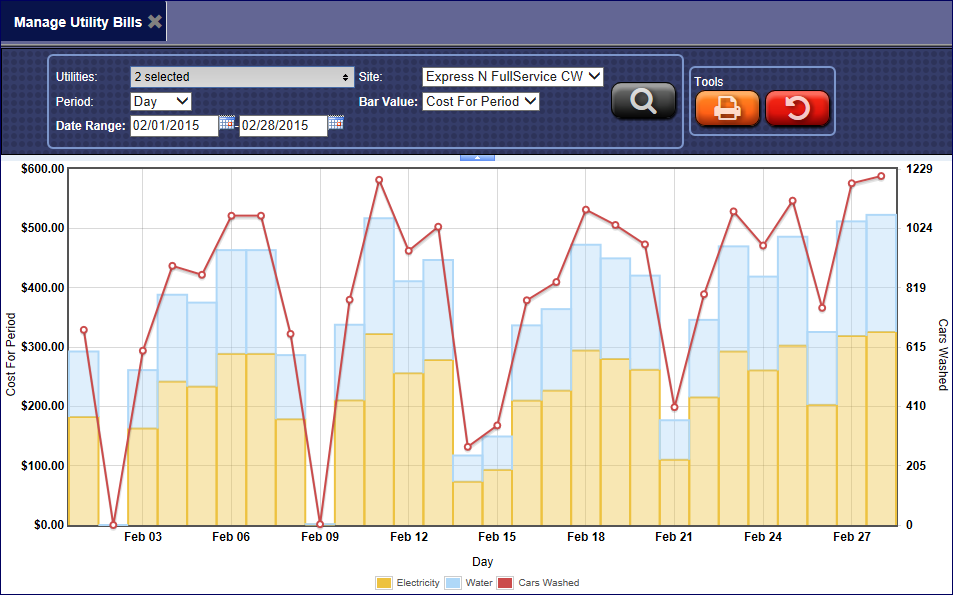
The following is an example of the Utility Usage Chart. The number of cars washed appears on the chart as a red line.