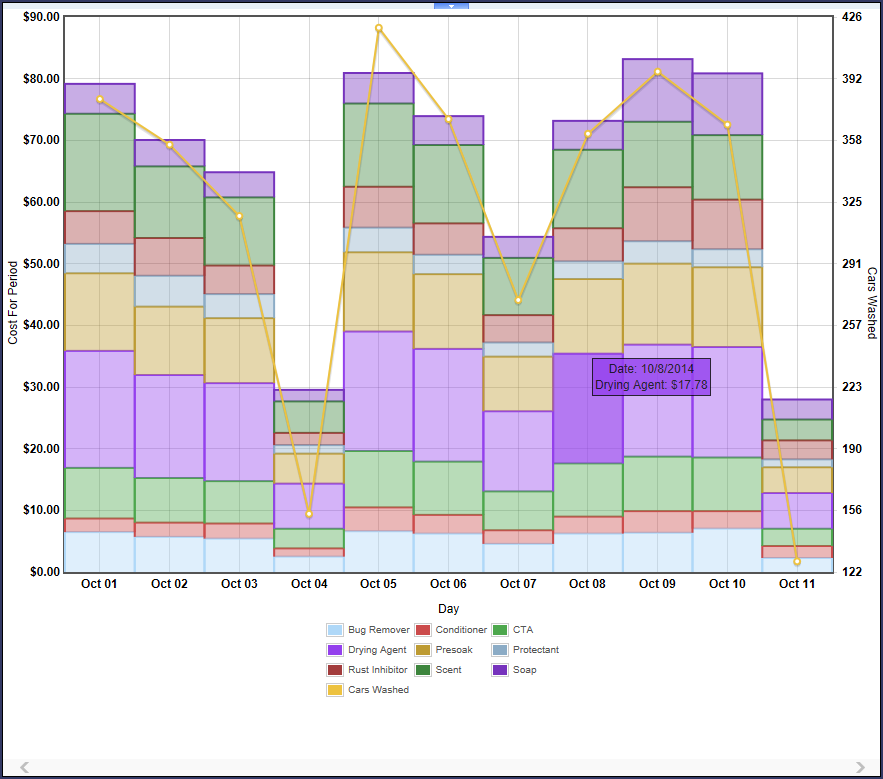
To view a Chemical Usage bar chart, along with information on the number of vehicles washed, follow these steps:
- At WashConnect logon, select a site.
- On the Chemicals menu, click Chemical Usage.
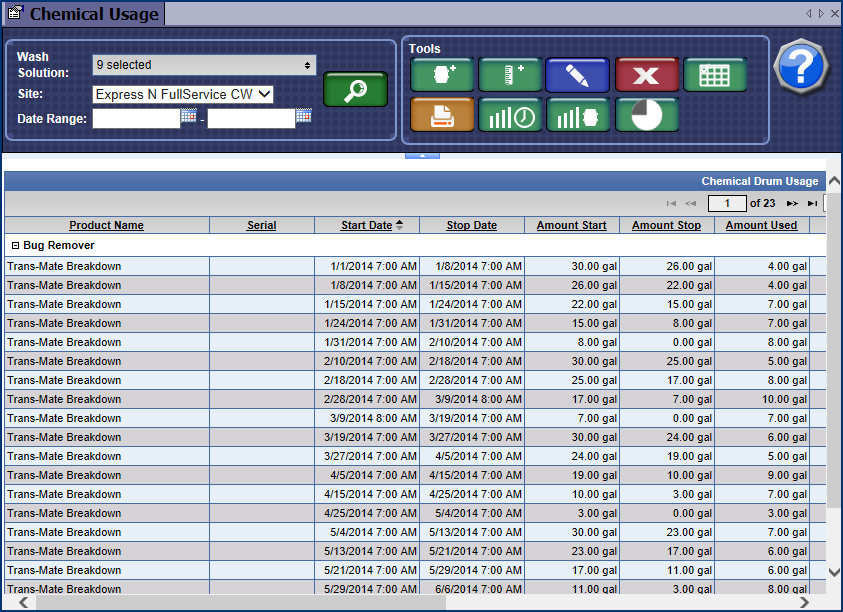
- Click the Chemical Usage Chart button.

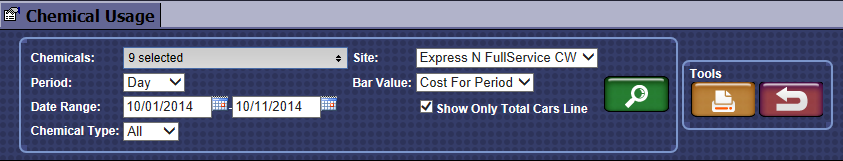
- In the Chemicals box, select one or more Chemicals.
- In the Period box, select Day or Month.
- In the Date Range boxes, select the beginning date and the end date.
- In the Chemical Type box, select All, Base, or Extra.
- In the Site box, select the site.
- In the Bar Value box, select Cost For Period or Cost Per Car.
- Click to select the Show Only Total Cars Line check box.
- Click the Search button.

- Click the Print button or the Cancel button.

