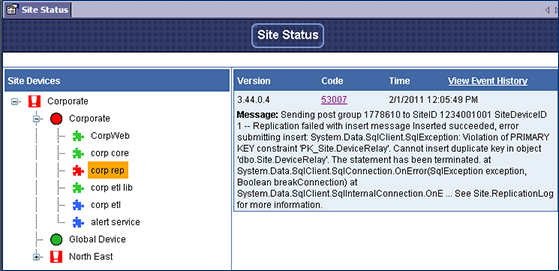
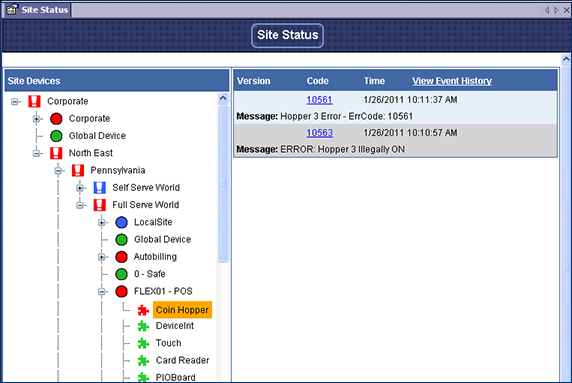
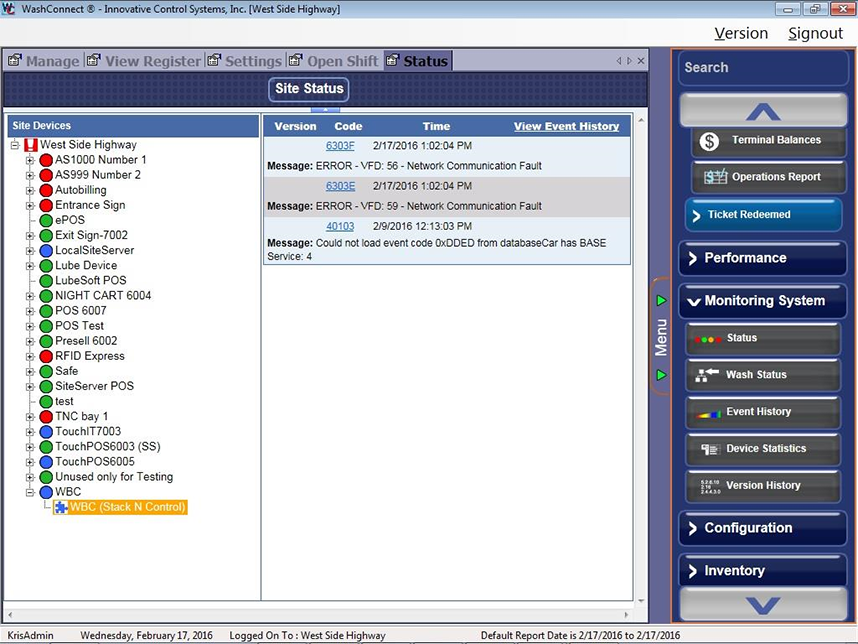
The site status allows you to see if all your sites are open and functioning properly. View the status or error message associated with any component.
To view the status of a device or component, follow these steps:
- On the Monitoring System menu, click the Status button.
The Status tab appears.
- Click the Expand Tree node to view devices and components.

Status icons appear. Only components report messages.
- Click to select a component.
- Green components are operating normally.
- Blue components have been repaired. Click to see message.
- Yellow components indicate a minor system issue. Click to see status message. (i.e., minor system issue such as a device out of paper.)
- Red components. Click to see error messages.


