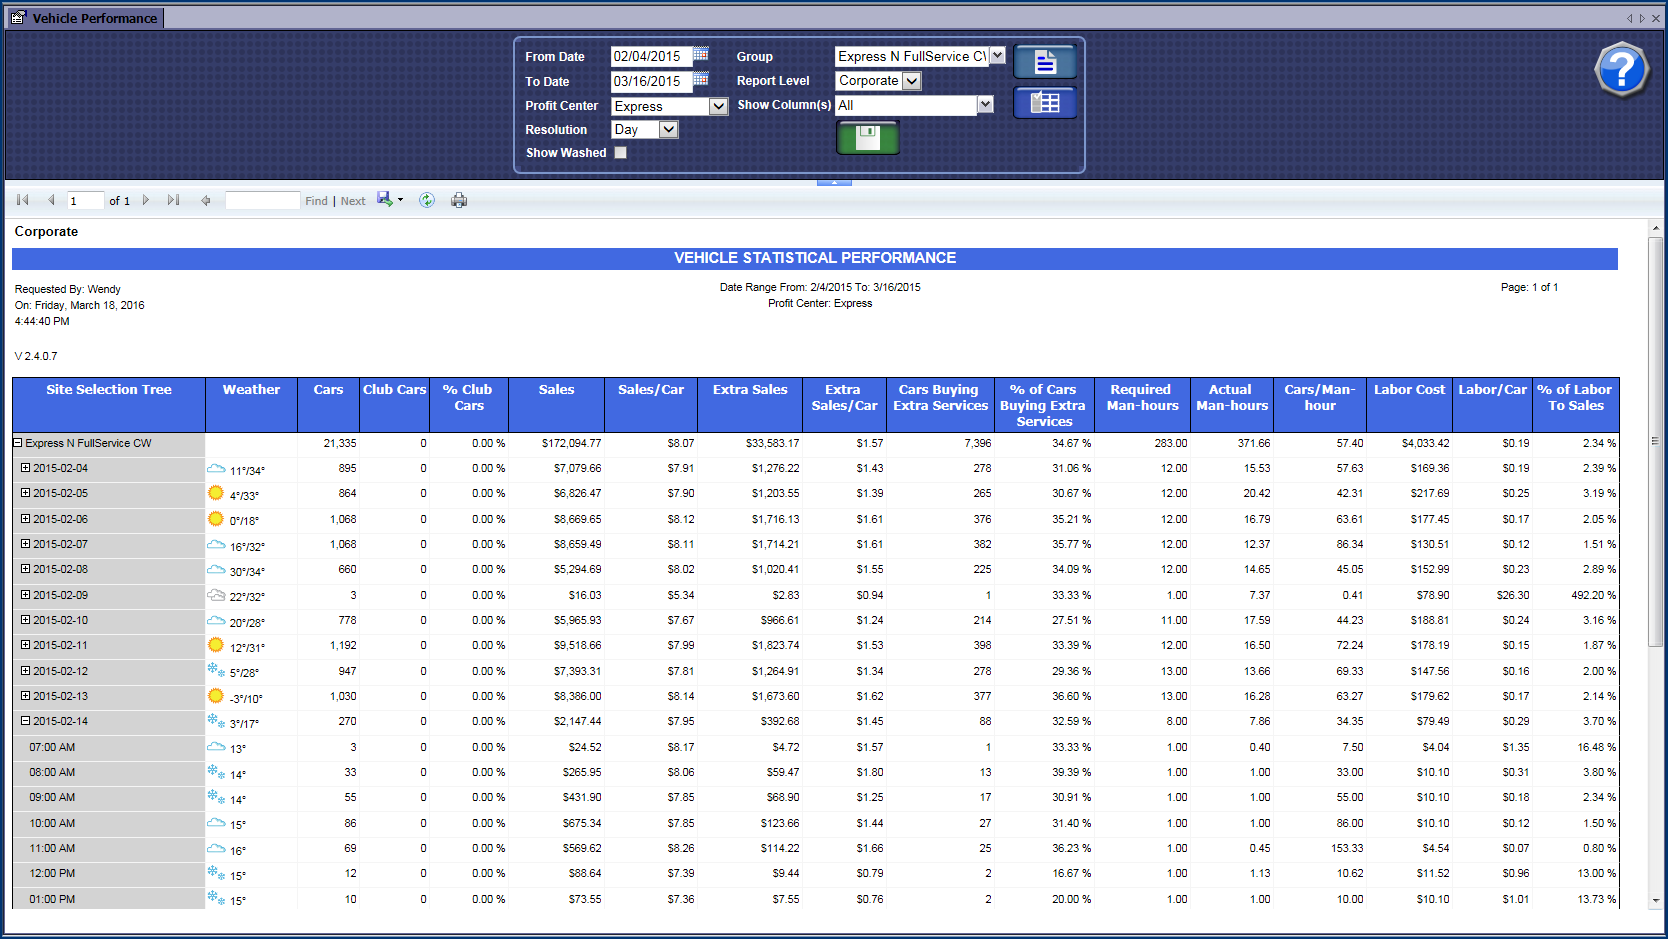
The Vehicle Statistical Performance Report (VSPR) displays information on how the wash is doing for the selected time period. It can be used to assist in finding patterns, such as determining slow times during the day or week or determining when more employees will be required to facilitate the number of vehicles being washed.
The VSPR can be viewed for a selected date range and the user can specify which profit centers should display information on the report. The Resolution menu selection can be used to view the report based on an Annual, Monthly, Weekly, Daily, or Hourly breakdown.
For a complete list of information that is displayed on the VSPR and their descriptions, please see: Vehicle Statistical Performance Descriptions.
To view the Vehicle Statistical Performance Report, follow these steps:
- On the Performance menu, click Vehicle Performance.
The Vehicle Performance tab appears.
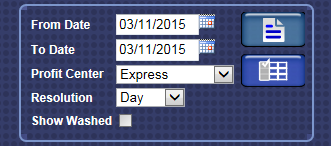
- In the From Date and To Date boxes, select dates for a date range.
- In the Profit Center box, select a profit center.
This is the level where you want reporting to start in the organizational layout.
- In the Resolution box, select a resolution: Annual, Month, Week, Day, or Hour.
For example, if you select Day, then each lowest-level summary row in the report will be totaled for a day, not a month or a year.
NOTE: Weather data will be displayed on an hour by hour basis as well as daily averages. Weather settings need to be configured, see Global Configurations. Also, if selecting week, weeks will begin with the First Day of Week setting from the Global Configuration.
- In Show Washed box, click to mark the check box.
- If the box is unchecked, the report will show car washes sold, meaning not necessarily washed.
- If the box is checked, the report will show data from the controller transactions only, meaning cars washed. The report will always show data by tunnel.
- Click the Preferences
 button, to select the Group, Report Level, and Columns.
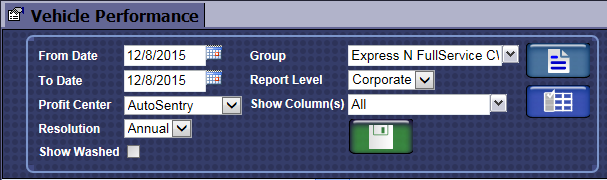
- In the Group box, select a Group.
- In the Report Level box, select a report level where you want reporting to end in the Corporate structure.
- In the Show Column(s) box, select one or more columns to determine the report column headers.
- Click the Save button to save the Group, Report Level and Show Columns preferences for future ease of use.
- Click the View Report button.
The Vehicle Performance Report includes familiar car wash industry metrics, such as Labor Costs per Car, Cars per Man Hour and Percent of Labor to Sales. But those metrics alone do not take labor minimums or labor efficiencies into account. For a truer picture, you can view the Performance Gauge report.
Report Toolbar