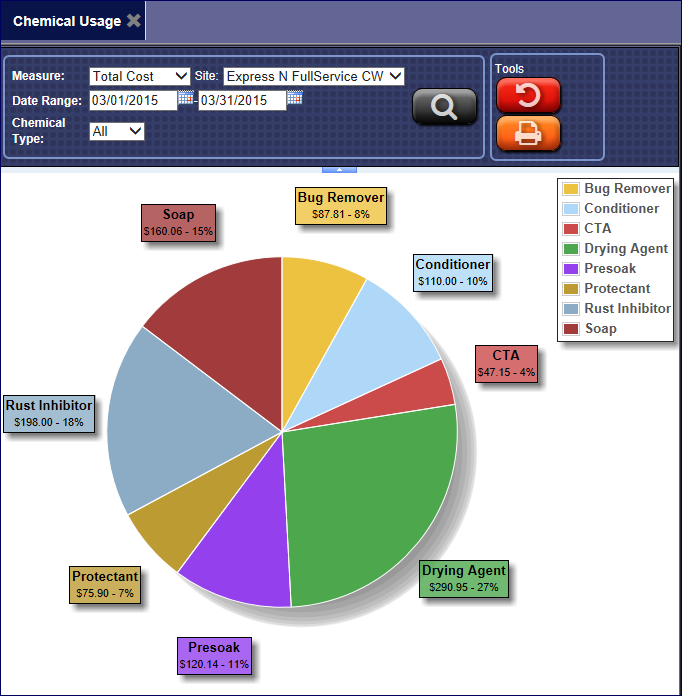
To view a Chemical Breakdown pie chart, which shows the percentage of chemical expenses by type for a given time period, follow these steps:
- At WashConnect logon, select a site.
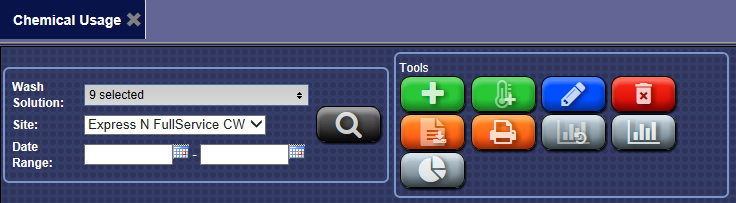
- On the Chemicals menu, click Chemical Usage.
- Click the Chemical Breakdown Chart button.

- In the Measure box, select Total Cost or Cost per Car.
- In the Site box, select the site.
- In the Date Range box, select the beginning date and the end date.
- In the Chemical Type box, select All, Base or Extra.
- Click the Search button.

- Click the Print button -or- the Cancel button.

