
To view the Projection Analysis, follow these steps:
NOTE: At WashConnect logon, select Corporate to view all sites and regions, or select the local site and view only the local site.
- Log in to WashConnect, select your local site, and then select the Log In button.
NOTE: Multiple sites are only available when logged in to WashConnect Corporate.
- Select Performance > Projection.
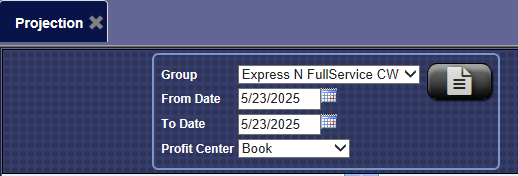
- In the Group box, make a selection.
- In the From Date box, enter a date.
- In the To Date box, enter a date.
- In the Profit Center list, select a profit center.
- Click the View Report button.

The Dashboard Projection Analysis appears.
Tip: When using this report to assist in scheduling staff, view months to observe the weather pattern in order to anticipate scheduling staff.
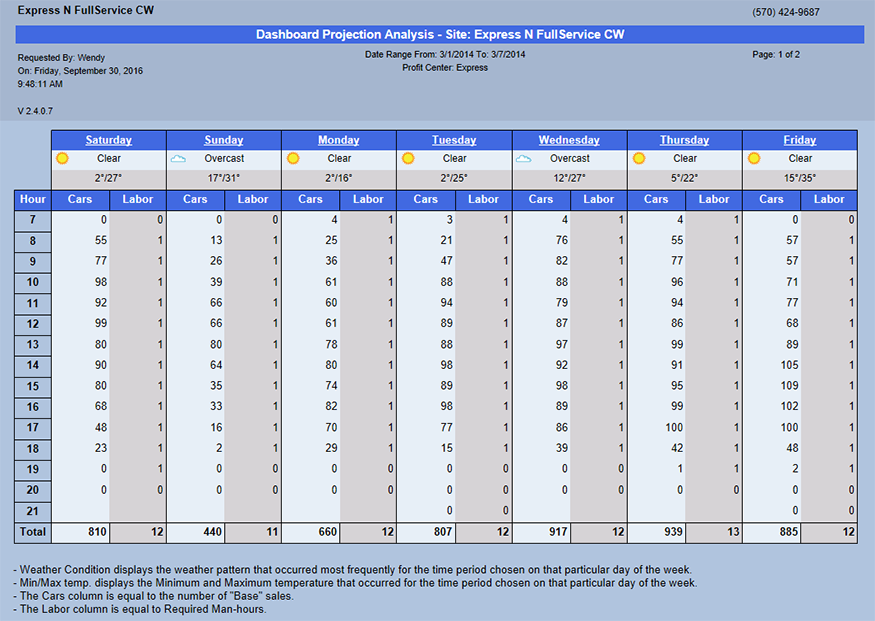
For example, if you look at the 7 o’clock hour in the above screen shot, add all the cars washed then divide by the number of days.
NOTE: For the average cars washed per day calculation, the amount of days will adjust if there are zero cars washed for that hour.
Correct: 0+0+4+3+4+4+0=15 15/4=3.75 Average Cars
Wrong: 0+0+4+3+4+4+0=15 15/7=2.15 Average Cars

- From the Projection Analysis and Chart toolbar, you can Export, Save, or Print the report.
Print a Report
Export a Report
Report Toolbar
For example, if a site normally washes more cars on a Sunday compared to a Monday, and they notice that in the month of December they washed more cars on Monday than Sundays, analyzing the weather information might reveal that it snowed on the majority of Sundays during the month and therefore customers were visiting the wash on Monday to wash the salt off of their vehicles. This could reveal a trend that on days after a snowstorm that the site might need more staffing than they normally would need on that day of the week, due to customers washing the salt off of their vehicles.
The Projection report is used to adjust staffing to ensure it is aligned with the demand at the wash. It allows the user to see if their targeted labor cost KPI is accurate and if the employee man hours that are setup align with the amount of business that is being done at the site to assist in making decisions on how to staff the wash in the future.
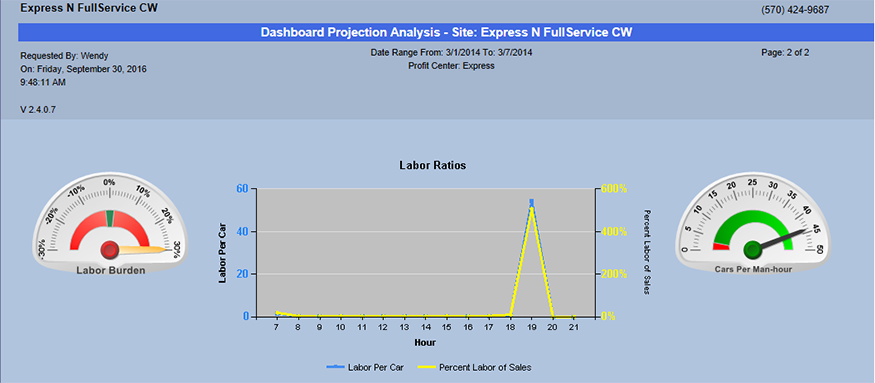
The Projection report provides charts and graphs to view weather conditions, cars washed, and labor man hours required for the selected profit center and specified date range.
Align staff with demand by forecasting trends in staffing with cars washed.
For example, if a site normally washes more cars on a Sunday compared to a Monday and they notice that in the month of December they washed more cars on Monday than Sundays analyzing the weather information might reveal that it snowed on the majority of Sundays during the month and therefore customers were visiting the wash on Monday to wash the salt off of their vehicles. This could reveal a trend that on days after a snowstorm that the site might need more staffing than they normally would on that day, regardless of the day of week, due to customers washing the salt off of their vehicles.
The Projection report is used to adjust staffing to ensure it is aligned with the demand at the wash. It allows the user to see if their targeted labor cost KPI is accurate and if the employee man hours that are setup align with the amount of business that is being done at the site to assist in making decisions on how to staff the wash in the future.