To monitor current site devices and the status of components, follow these steps:
-
Open WashConnect. In the Region(s) panel, select Corporate, region, or the local site, and then click the Log In button.
NOTE: When logged in at the Corporate location, the entire Corporate structure will be available. When logged in at a site level, only that site will be available for selection.
-
Select Monitoring System > Status.
- Click the device in question.
The component that generated an error displays in yellow or red.
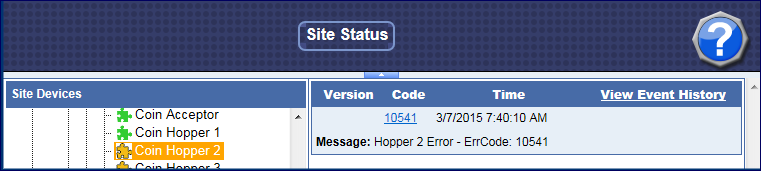
- Click the component to view error details.
The error code appears with an error message, and incident date and time.
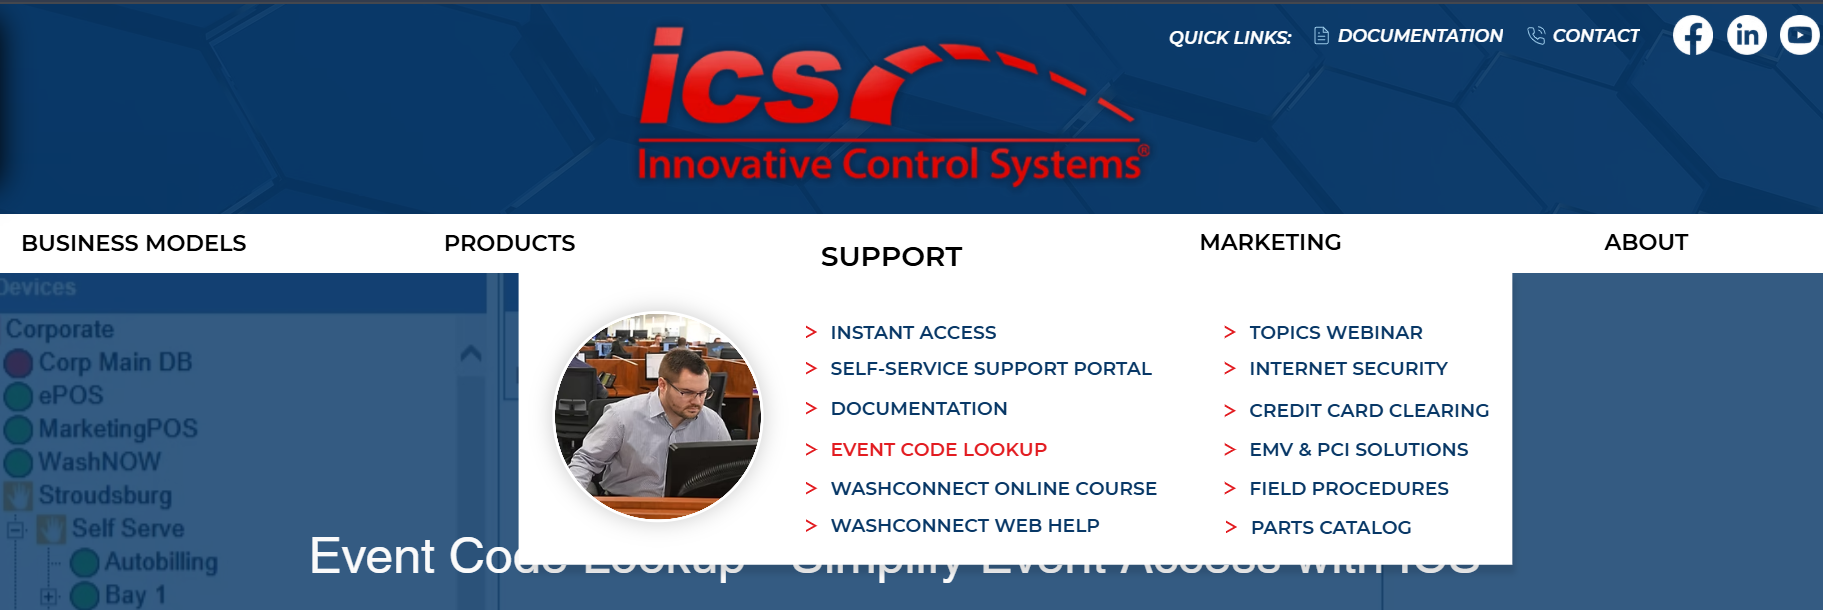
- Click on the Code link.
Each error or event code links to an online database with step-by-step troubleshooting instructions.
NOTE: You can also receive email alerts with error codes. See Subscribe to Email Alerts.