To retrieve past dates for most Dashboard cards, follow these steps:
- Open WashConnect, in Region(s) select Corporate, region, or the local site, and then click the Log In button.
NOTE: Multiple sites are only available when viewing the Dashboard Reports while logged in to WashConnect Corporate. When logged in at a site level, only that site will be available for selection.
- Select Performance > Dashboard.
- Click the Settings icon to make setting changes.

The Settings dialog appears broken down in three sections: Historical Data Options, Profit Centers, and Available Cards.
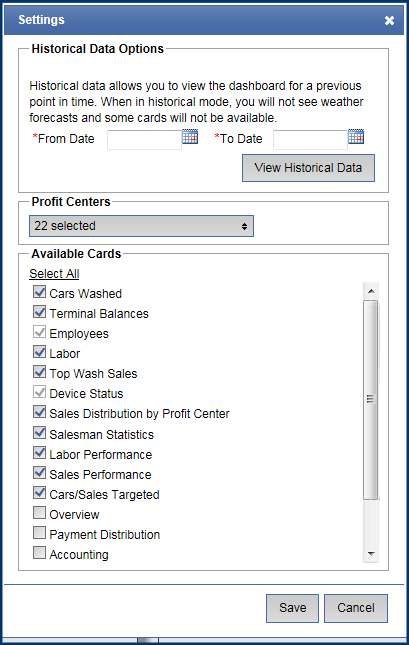
- In the From Date and To Date boxes, select the previous period of time to view historical dashboard data.
- In the Profit Centers box, select the profit centers to view.
- In the Available Cards boxes, click to select the report cards to view on the dashboard.
NOTE: In historical mode, some weather forecasts and some cards will be disabled and appear dimmed.
- Click the View Historical Data button.
- Click the Save button.
View the Dashboard cards for the selected dates and profit centers.
- After selecting and viewing historical data, select the Settings icon.
- Click the View Live Data button.
NOTE: The View Live Data button only appears after you viewed historical dates and have not closed the Dashboard tab.
- Click the Save button.

The settings are saved with the selected profit centers and cards for real-time data.