
To view the Performance Gauge Report, follow these steps:
-
Log in to the WashConnect, select your local site, and then select the Log In button.
NOTE: Multiple sites are only available when viewing the Dashboard Reports when logged in to WashConnect Corporate.
- Select Performance > Performance Gauge.
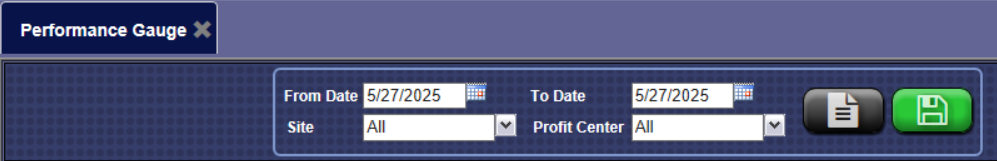
- In the From Date and To Date boxes, select a date range.
- In the Site box, select one or more sites.
- In the Profit Center box, select one or more profit centers.
- To save your selections from steps #3, #4, and #5, click the Save Preferences button.

When you open this report tab again, these default preferences will automatically populate.
- Click the View Report button.

At the end of the day after you have managed the labor for each profit center, you can view the Performance Gauge report. It is like your ultimate report card that shows you in real dollars how well labor has been managed for the day.
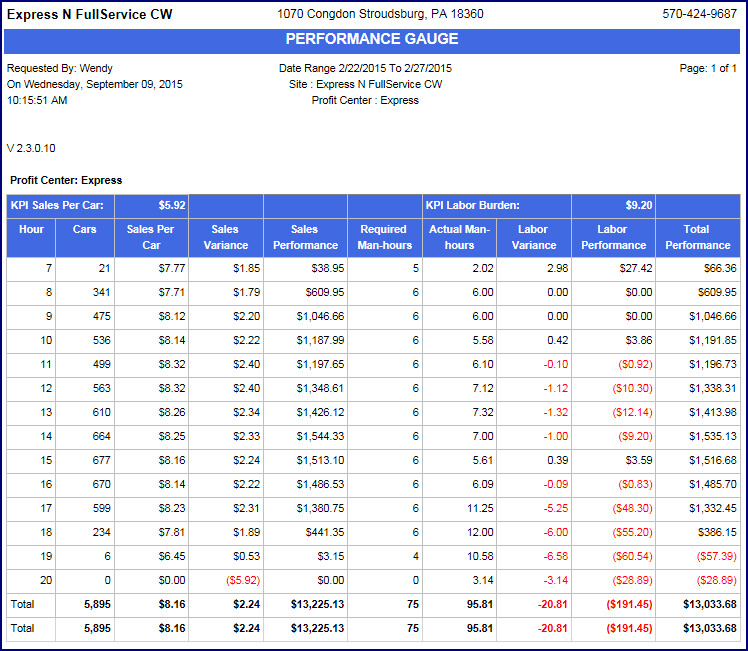
- From the Performance Gauge Report toolbar, you can Export, Save, or Print the report.
Print a Report
Export a Report
Report Toolbar
The Performance Gauge screen is only as good as your targets. The Sales Per Car and Labor Burden amounts are the key drivers of this screen. Try changing them, and then re-run the report to see how it affects your numbers. You can also change the date range to view the Performance Gauge for a month, a quarter, or the whole year to date. All the numbers for the date range you select are broken down to a single representative workday.
Adjusting your targets and reviewing the numbers like this can quickly show you whether your facility is overstaffed or understaffed during peak hours, and whether your employees are exceeding their sales performance targets, or costing you money.
Altogether, the system helps customers receive the consistent speed of service and quality intended at the costs you have budgeted.