
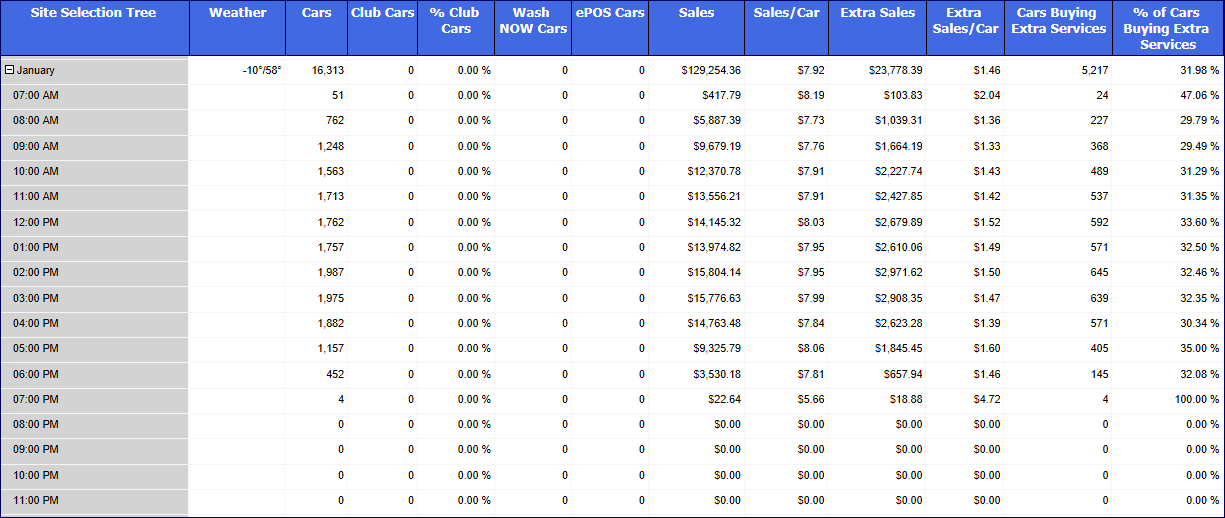
See Vehicle Statistical Performance Descriptions.
To view the Vehicle Statistical Performance Report, follow these steps:
- Open WashConnect. In the Region(s) panel, select Corporate, region, or the local site, and then click the Log In button.
NOTE: Multiple sites are only available when viewing the Dashboard Reports while logged in to WashConnect Corporate. When logged in at a site level, only that site will be available for selection.
-
Select Performance > Vehicle Performance.
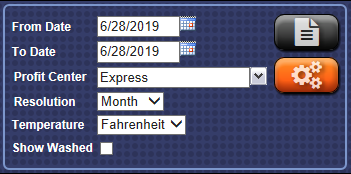
- In the From Date box, enter a date.
- In the To Date box, enter a date.
- In the Profit Center box, select a profit center.
- In the Resolution box, select a resolution: Annual, Month, Week, Day, or Hour.
For example, if you select Day, then each lowest-level summary row in the report will be totaled for a day, not a month or a year.
NOTE: Weather data will be displayed on an hour-by-hour basis as well as daily averages. Weather settings need to be configured, see Global Configurations. Also, if selecting week, weeks will begin with the First Day of Week setting from the Global Configuration.
- In the Show Washed box, click to select:
- If the Show Washed box is unchecked, the report will show car washes sold, meaning not necessarily washed.
- If the Show Washed box is checked, the report will show data from the controller transactions only, meaning cars washed. The report will always show data by tunnel.
- Click the Preferences button to select the Level, Group (Corporate only), and Columns.

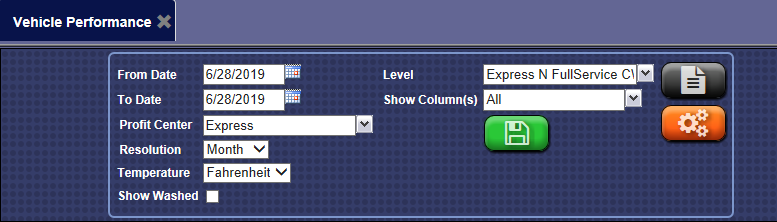
- In the Level box, make a selection of one or more levels and sites from the list (Corporate Only). This is the level where you want reporting to start in the organizational layout.
- In the Show Column(s) box, click to select one or more columns to view in this report.
- To save your selections from steps #3 - #10 click the Save Preferences button.

When you open this report tab again, these default preferences will automatically populate.
TIP: Compare one or more sites against each other from the Vehicle Performance Report.
- Click the View Report button.

The Vehicle Performance Report includes familiar car wash industry metrics, such as Labor Costs per Car, Cars per Man Hour and Percent of Labor to Sales. But those metrics alone do not take labor minimums or labor efficiencies into account. For a truer picture, you can view the Performance Gauge report.
- From the Vehicle Performance Report toolbar, you can Export, Save, or Print the report.
Print a Report
Export a Report
Report Toolbar