To view the status or error message associated with any device or component, follow these steps:
-
Open WashConnect. In the Region(s) panel, select Corporate, region, or the local site, and then click the Log In button.
NOTE: When logged in at the Corporate location, the entire Corporate structure will be available. When logged in at a site level, only that site will be available for selection.
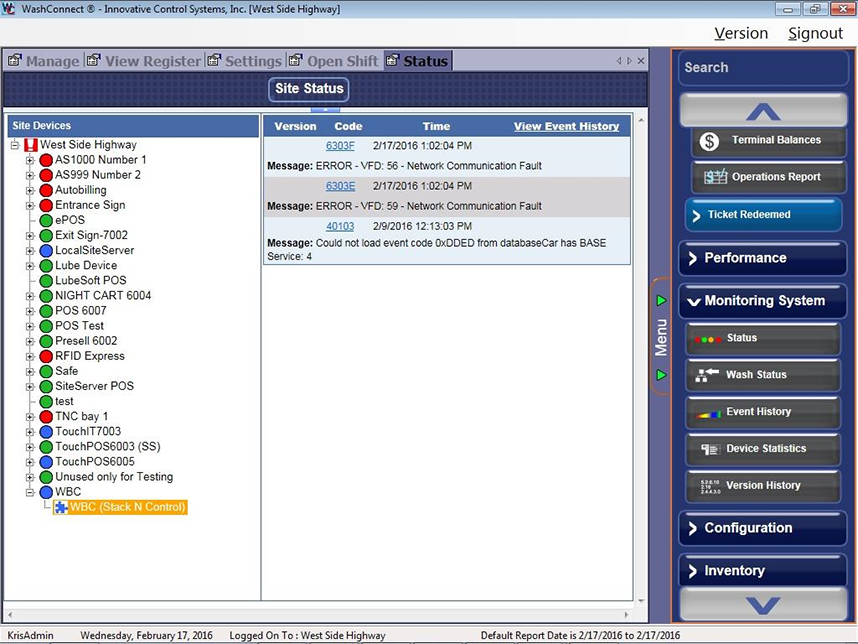
- Select Monitoring System > Status.
The Status tab appears.
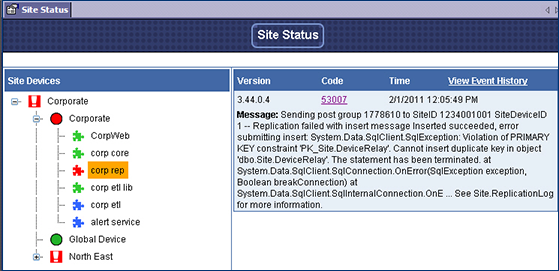
- Click the Expand Tree node to view devices and components.

Status icons appear. Messages appear for devices only.
- Click to select a component.
- Green components are operating normally.
- Blue components have been repaired. Click to see message.
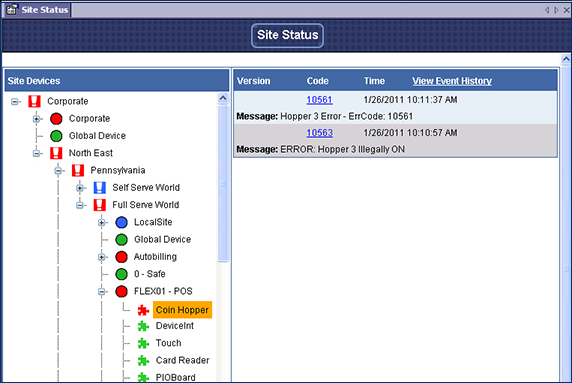
- Yellow components indicate a minor system issue. Click to see status message. (i.e., minor system issue such as a device out of paper.)
- Red components. Click to see error messages.